Statistics on presidential election results in Ghana from 1992, 1996, 2000 and 2004.These figures are according to the electoral Commission’s website.
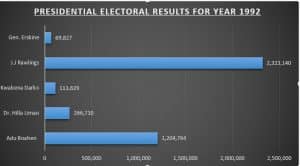
PRESIDENTIAL ELECTORAL RESULTS FOR YEAR 1992
PRESIDENTIAL
| REGION | NPP | PNC | NIP | NDC | PHP | |||||
| Adu Boahen | % | Dr. Hilla Liman | % | Kwabena Darko | % | J.J Rawlings | % | Gen. Erskine | % | |
| WESTERN | 89,800 | 22.8 | 33,760 | 8.6 | 21,924 | 5.6 | 239,477 | 60.7 | 9,325 | 2.4 |
| CENTRAL | 86,683 | 26 | 6,308 | 1.9 | 11,631 | 3.5 | 222,097 | 66.5 | 7,312 | 2.2 |
| GT ACCRA | 188,000 | 37 | 22,027 | 20,731 | 4.1 | 270,825 | 53.4 | 5,861 | 1.3 | |
| VOLTA | 17,295 | 3.6 | 7,431 | 1.6 | 3,534 | 0.7 | 446,365 | 93.2 | 4,105 | 0.9 |
| EASTERN | 190,327 | 37.7 | 9,747 | 1.9 | 11,730 | 2.3 | 288,726 | 57.3 | 3,663 | 0.7 |
| ASHANTI | 431,380 | 60.5 | 17,620 | 2.5 | 25,298 | 3.6 | 234,237 | 32.9 | 4,049 | 0.57 |
| B/AHAFO | 116,041 | 29.5 | 20,646 | 5.3 | 8,979 | 2.3 | 243,361 | 61.9 | 3,837 | 1 |
| NORTHERN | 52,539 | 16.3 | 35,452 | 11 | 4,682 | 1.5 | 203,004 | 63 | 26,715 | 8.3 |
| UPPER EAST | 21,164 | 10.5 | 65,644 | 32.5 | 2,791 | 1.4 | 108,999 | 54 | 3,348 | 1.7 |
| UPPER WEST | 11,535 | 8.9 | 48,075 | 37.1 | 2,329 | 1.8 | 66,049 | 51 | 1,612 | 1.2 |
| NATIONAL TOTAL | 1,204,764 | 30.3 | 266,710 | 6.7 | 113,629 | 2.86 | 2,323,140 | 58.4 | 69,827 | 1.76 |
Parliamentary results
| 29 DECEMBER 1992 PARLIAMENTARY ELECTION | |||||
| Region | Party |
Total Seats |
|||
| National Democratic Congress
(NDC) |
National Convention Party
(NCP) |
Every Ghanaian Living Everywhere (EGLE) |
Independents |
||
| Ashanti | 33 | – | – | – | 33 |
| Brong-Ahafo | 20 | – | – | 1 | 21 |
| Central | 16 | 1 | – | – | 17 |
| Eastern | 22 | 3 | 1 | – | 26 |
| Greater Accra | 22 | – | – | – | 22 |
| Northern | 23 | – | – | – | 23 |
| Upper East | 11 | – | – | 1 | 12 |
| Upper West | 8 | – | – | – | 8 |
| Volta | 18 | 1 | – | – | 19 |
| Western | 16 | 3 | – | – | 19 |
| National Total | 189 | 8 | 1 | 2 | 200 |
| REGION | VALID VOTES | PERCENTAGE TURNOUT | REGISTERED VOTERS |
| WESTERN | 394,286 | 47.8 | 858,246 |
| CENTRAL | 334,031 | 47.7 | 733,004 |
| GT. ACCRA | 507,444 | 46 | 1,105,768 |
| VOLTA | 478,730 | 62.4 | 787,453 |
| EASTERN | 504,193 | 51 | 1,015,185 |
| ASHANTI | 712,584 | 53.1 | 1,265,670 |
| B/AHAFO | 392,864 | 46 | 578,187 |
| NORTHERN | 322,392 | 50.7 | 499,229 |
| UPPER EAST | 201,946 | 51.5 | 337,215 |
| UPPER WEST | 129,600 | 51 | 221,413 |
| NATIONAL TOTAL | 3,978,070 | 53.75 | 7,401,370 |
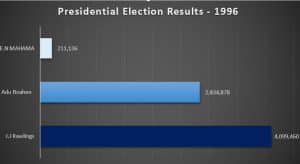
ELECTORAL RESULTS FOR YEAR 1996
PRESIDENTIAL
| REGION | NDC | NPP | PNC | |||
| J.J Rawlings | % | Adu Boahen | % | E.N MAHAMA | % | |
| WESTERN | 405,992 | 57.3 | 289,730 | 40.9 | 12,862 | 1.8 |
| CENTRAL | 330,841 | 55.2 | 259,555 | 43.3 | 8,715 | 1.5 |
| GT. ACCRA | 658,626 | 54.0 | 528,484 | 43.3 | 32,723 | 2.7 |
| VOLTA | 690,421 | 94.5 | 34,538 | 4.7 | 5,292 | 0.7 |
| EASTERN | 459,092 | 53.8 | 384,597 | 45.0 | 10,251 | 1.2 |
| ASHANTI | 412,474 | 32.8 | 827,804 | 45.0 | 17,736 | 1.4 |
| B/AHAFO | 395,381 | 61.7 | 230,457 | 36.0 | 14,635 | 2.3 |
| NORTHERN | 370,030 | 61.1 | 199,801 | 33.0 | 35,472 | 5.9 |
| UPPER EAST | 230,791 | 69.0 | 58,041 | 17.4 | 45,696 | 13.7 |
| UPPER WEST | 145,812 | 74.6 | 21,871 | 11.2 | 27,754 | 14.2 |
| NATIONAL TOTAL | 4,099,460 | 57.4 | 2,834,878 | 39.7 | 211,136 | 3.0 |
| 7 DECEMBER 1996 PARLIAMENTARY ELECTION | |||||
|
Region |
Party |
Total Seats |
|||
| National Democratic Congress
(NDC) |
New Patriotic Party
(NPP) |
People’s Convention Party (PCP) | People’s National Convention
(PNC) |
||
| Ashanti | 5 | 27 | – | – | 32 |
| Brong-Ahafo | 17 | 4 | – | – | 21 |
| Central | 14 | 3 | – | – | 17 |
| Eastern | 15 | 11 | – | – | 26 |
| Greater Accra | 13 | 9 | – | – | 22 |
| Northern | 18 | 3 | 1 | 1 | 23 |
| Upper East | 12 | – | – | – | 12 |
| Upper West | 8 | – | – | – | 8 |
| Volta | 19 | – | – | – | 19 |
| Western | 12 | 3 | 4 | – | 19 |
| National Total* | 133 | 60 | 5 | 1 | 199 |
*Voting was postponed in one Ashanti Region constituency because of a legal dispute concerning the eligibility of candidates. The seat was subsequently won by the New Patriotic Party (NPP) in a by-election held in June 1997.
ELECTORAL RESULTS FOR YEAR 2000
| 7 DECEMBER 2000 PARLIAMENTARY ELECTION | ||||||
|
Region |
Party |
Total Seats |
||||
| New Patriotic Party
(NPP) |
National Democratic Congress (NDC) | People’s National Convention (PNC) | Convention People’s Party
(CPP) |
Independents | ||
| Ashanti | 31 | 2 | – | – | – | 33 |
| Brong Ahafo | 14 | 7 | – | – | – | 21 |
| Central | 8 | 9 | – | – | – | 17 |
| Eastern | 18 | 8 | – | – | – | 26 |
| Greater Accra | 16 | 6 | – | – | – | 22 |
| Northern | 3 | 18 | 1 | – | 1 | 23 |
| Upper East | 2 | 8 | 1 | – | 1 | 12 |
| Upper West | – | 7 | 1 | – | – | 8 |
| Volta | – | 17 | – | – | 2 | 19 |
| Western | 8 | 10 | – | 1 | – | 19 |
| National Total | 100 | 92 | 3 | 1 | 4 | 200 |
ELECTORAL RESULTS FOR YEAR 2004
| 7 DECEMBER 2004 PARLIAMENTARY ELECTION | ||||||
|
Region |
Party |
Total Seats |
||||
| New Patriotic Party
(NPP) |
National Democratic Congress
(NDC) |
People’s National Convention (PNC) | Convention People’s Party
(CPP) |
Independents | ||
| Ashanti | 36 | 3 | – | – | – | 39 |
| Brong-Ahafo | 14 | 10 | – | – | – | 24 |
| Central | 16 | 2 | – | 1 | – | 19 |
| Eastern | 22 | 6 | – | – | – | 28 |
| Greater Accra | 16 | 11 | – | – | – | 27 |
| Northern | 8 | 17 | – | – | 1 | 26 |
| Upper East | 2 | 9 | 2 | – | – | 13 |
| Upper West | 1 | 7 | 2 | – | – | 10 |
| Volta | 1 | 21 | – | – | – | 22 |
| Western | 12 | 8 | – | 2 | – | 22 |
| National Total | 128 | 94 | 4 | 3 | 1 | 23 |
ELECTORAL RESULTS FOR YEAR 2008
PARLIAMENTARY ELECTION
| Party | Number of Seats |
| National Democratic Congress (NDC) | 114 |
| New Patriotic Party (NPP) | 107 |
| People’s National Convention (PNC) | 2 |
| Convention People’s Party (CPP) | 1 |
| Independents | 4 |
| Vacant* | 2 |
| TOTAL | 230 |
*Petitions were filed by candidates challenging the results in two constituencies. When the results were officially declared, both the National Democratic Congress (NDC) and New Patriotic Party (NPP) each gained an additional seat, bringing their totals to 115 and 108, respectively.
| REGION | TOTAL VALID VOTES | REJECTED BALLOTS | TOTAL VOTES CAST | REG. VOTERS | TURNOUT | |
| WESTERN | 708,584 | 11,927 | 720,511 | 967,340 | 74.5 | |
| CENTRAL | 599,111 | 13,213 | 612,324 | 774,469 | 79.1 | |
| GT. ACCRA | 1,219,833 | 7,011 | 1,226,844 | 1,563,916 | 78.4 | |
| VOLTA | 730,251 | 3,687 | 733,938 | 896,766 | 81.8 | |
| EASTERN | 853,940 | 2,219 | 856,159 | 1,056,222 | 81.1 | |
| ASHANTI | 1,258,014 | 12,057 | 1,270,071 | 1,592,854 | 79.7 | |
| B/AHAFO | 640,473 | 10,004 | 650,477 | 903,989 | 72.0 | |
| NORTHERN | 605,303 | 17,840 | 623,143 | 809,433 | 76.99 | |
| UPPER EAST | 334,528 | 22,387 | 356,915 | 442,601 | 80.6 | |
| UPPER WEST | 195,437 | 10,763 | 206,200 | 272,015 | 75.81 | |
| NATIONAL TOTAL | 7,145,474 | 111,108 | 7,256,582 | 9,279,605 | 78.2 |